How to monitor your node
Prerequisites
Prepare the node operating environment, specific information can follow this article
Install Prometheus and configure the environment
We use Prometheus as the node data collection tool
Configure the Prometheus environment
To prevent Prometheus from logging in, we need to set
--no-create-homeand create a user for Prometheussudo useradd --no-create-home --shell /usr/sbin/nologin prometheusCreate a directory where the configuration and executable files are stored
sudo mkdir /etc/prometheus
sudo mkdir /var/lib/prometheus
Modify folder ownership
sudo chown -R prometheus:prometheus /etc/prometheus
sudo chown -R prometheus:prometheus /var/lib/prometheus
Install Prometheus
After configuring the environment, we start the installation. You can check the latest version in the Releases of the official Github Repo and replace the version of the following command:
sudo apt-get update && apt-get upgrade
wget https://github.com/prometheus/prometheus/releases/download/v2.32.1/prometheus-2.32.1.linux-amd64.tar.gz
tar xfz prometheus-*.tar.gz
cd prometheus-2.32.1.linux-amd64
After the download is complete, there will be two executable files and two folders in the current path folder:

Copy the executable file to the specified folder and modify the ownership:
sudo cp ./prometheus /usr/local/bin/
sudo cp ./promtool /usr/local/bin/
sudo chown prometheus:prometheus /usr/local/bin/prometheus
sudo chown prometheus:prometheus /usr/local/bin/promtool
Copy the folder to the specified folder and modify the ownership:
sudo cp -r ./consoles /etc/prometheus
sudo cp -r ./console_libraries /etc/prometheus
sudo chown -R prometheus:prometheus /etc/prometheus/consoles
sudo chown -R prometheus:prometheus /etc/prometheus/console_libraries
Delete redundant folders
cd .. && rm -rf prometheus*Test whether the Prometheus installation is successful
promtool check config /etc/prometheus/prometheus.ymlModify the ownership of the configuration file
sudo chown prometheus:prometheus /etc/prometheus/prometheus.yml
You can also choose to install through the official documentation
https://prometheus.io/docs/prometheus/latest/installation/
2.3. Configure Prometheus environment
After the installation is complete, we need to configure the Prometheus environment as follows:
sudo vim /etc/prometheus/prometheus.yml
Fill in:
global:
  scrape_interval: 15s
  evaluation_interval: 15s

rule_files:
  # - "first.rules"
  # - "second.rules"

scrape_configs:
  - job_name: "prometheus"
    scrape_interval: 5s
    static_configs:
      - targets: ["localhost:9090"]
  - job_name: "zeitgeist_node"
    scrape_interval: 5s
    static_configs:
      - targets: ["localhost:9616"]
Run Prometheus
Run the following command in Terminal:
sudo -u prometheus /usr/local/bin/prometheus --config.file /etc/prometheus/prometheus.yml --storage.tsdb.path /var/lib/prometheus/ --web.console.templates=/etc/prometheus/consoles --web.console.libraries=/etc/prometheus/console_libraries
After the operation is successful, the relevant log will be printed out.
Enter http://127.0.0.1:9090/graph in the browser to view and query related
information
Set Prometheus as a system service and run it automatically
Create service file
sudo vim /etc/systemd/system/prometheus.serviceEnter the following configuration:
[Unit]
  Description=Prometheus Monitoring
  Wants=network-online.target
  After=network-online.target

[Service]
  User=prometheus
  Group=prometheus
  Type=simple
  ExecStart=/usr/local/bin/prometheus \
  --config.file /etc/prometheus/prometheus.yml \
  --storage.tsdb.path /var/lib/prometheus/ \
  --web.console.templates=/etc/prometheus/consoles \
  --web.console.libraries=/etc/prometheus/console_libraries
  ExecReload=/bin/kill -HUP $MAINPID

[Install]
  WantedBy=multi-user.target
Reload
systemdand start the service:sudo systemctl daemon-reload && systemctl enable prometheus && systemctl start prometheus
Install Grafana and configure the environment
We use Grafana as a visualization tool for node information. Grafana will capture the data provided by Prometheus and visualize the output in real time, giving node operators a more intuitive experience
Install Grafana
Enter in Terminal:
sudo apt-get install -y adduser libfontconfig1
wget https://dl.grafana.com/oss/release/grafana_8.3.3_amd64.deb
sudo dpkg -i grafana_8.3.3_amd64.deb
The specific latest version can be found on the Grafana official website
Run and automatically run Grafana as a system service
Enter in Terminal:
sudo systemctl daemon-reload
sudo systemctl enable grafana-server
sudo systemctl start grafana-server
Configure Grafana data source
Enter the following IP in the browser and log in:
http://127.0.0.1:3000/login, the default account and password are bothadmin.Find the
Configurationbutton on the left, selectData Sources, and after entering, selectAdd data source.You can choose according to the data source you use. In this article, we choose Prometheus.
Set the data source parameters, set the
URLtohttp://localhost:9090, select the bottomSave & Test, if you seeData source is working, it means there is no problem with the configuration.
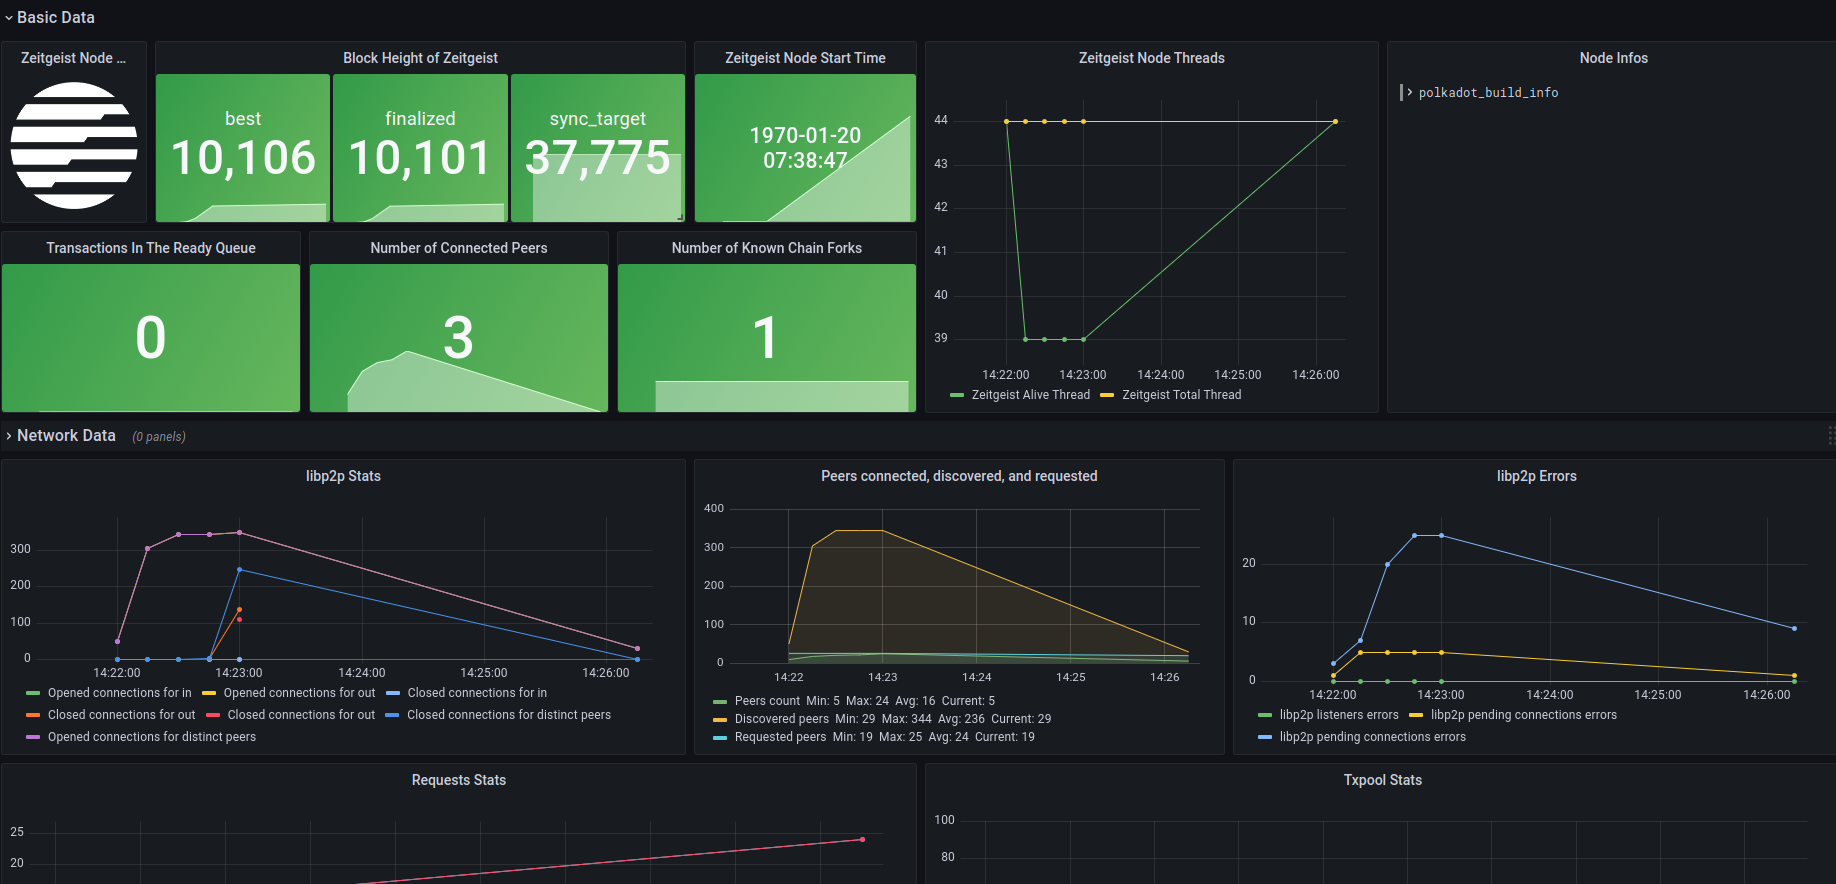
Monitor Zeitgeist node metrics
After completing all the above configurations, we can import the pre-designed Dashboard to monitor the key information of the node.
Select
Importin theCreatecolumn of the menu bar, we can choose to import from the grafana.com community with ID or through the Json file to import.Select
Load, confirm again that the column ofPrometheusis not selected wrong, and clickImport.To run the Zeitgeist node locally, please use the following command line to execute (currently only supports binary file operation)
./zeitgeist --chain=battery_station --pruning=archive --prometheus-port=9616After waiting a few seconds, you will see the data update in the interface.